

Work-in-progress - 2008-12-31
GPLin is now able to render and print charts not just for raw-mode but for CMYK composite mode, too. Since the project is so specialised, and since it's not necessarily obvious how to interpret the results, here are a few words about the results so far...
These experiments were conducted using an Epson R285 printer, with refillable cartridges and 3rd-party ink. I use 7DayShop glossy paper for most of my photo printing and since this is the paper on which I'm most interested in getting the best results possible, that's what I've used for these experiments.
The first job when confronted with a new paper is to figure out the best settings to use with it. In PhotoPrint, I've actually been using the "Photo Quality Inkjet Paper" setting, with a few tweaks to Density and Gamma, and then profiling it, rather than using a setting for a different type of photo glossy paper. The big problem with Gutenprint's media presets as they currently stand is that they're opaque - at least from the application's point of view. For that reason, for my experiments with GPLin I've been bypassing that altogether, using the "Raw" colour-correction mode. This essentially disables *all* of Gutenprint's internal colour adjustment, including adjustment for papertype and resolution. It does, however, mean I must take responsibility myself for making sure I don't lay down too much ink and flood the printer!
Using GPLin's Base Density step I take a rough guess at what the maximum density will be, and print out a sweep pattern. If I'm lucky, there will be some sign of over-inking at the extreme right of that sweep pattern, and using the scale above the sweep pattern I can read off the approximate maximum density I can use. If there's no over-inking in evidence I increase my initial estimate and try again.
Once I have a reasonable base density, I move onto the next step and determine an approximate gamma for the printer. Again, this involves printing off a sweep pattern and reading off on the scale where the printed sweep and a checquerboard pattern appear to match in intensity. This isn't terribly accurate - but that doesn't matter - this gamma value is only used to ensure a reasonably uniform spread of patches in the next step.
The previous two steps actually constitute a very rough preliminary linearization of the printer. Now we come to the more interesting part - generating and printing out a linearization target which will be read by an instrument. Generating the target is handled by ArgyllCMS - GPLin merely generates suitable parameters, and handles actually printing the generated target.
Currently that's as far as GPLin goes - reading in the chart must be done by hand, but once that's done, the graph_raw utility in GPLin can be used to plot each colorant's input value against the resulting L*ab value.
Since a picture is worth a thousand words, here are a couple of plots (creating using graph_raw) of linearization charts. One was produced in CMYK mode (hence, 4 colours), the other in Raw Channel mode (hence, 6 colours).
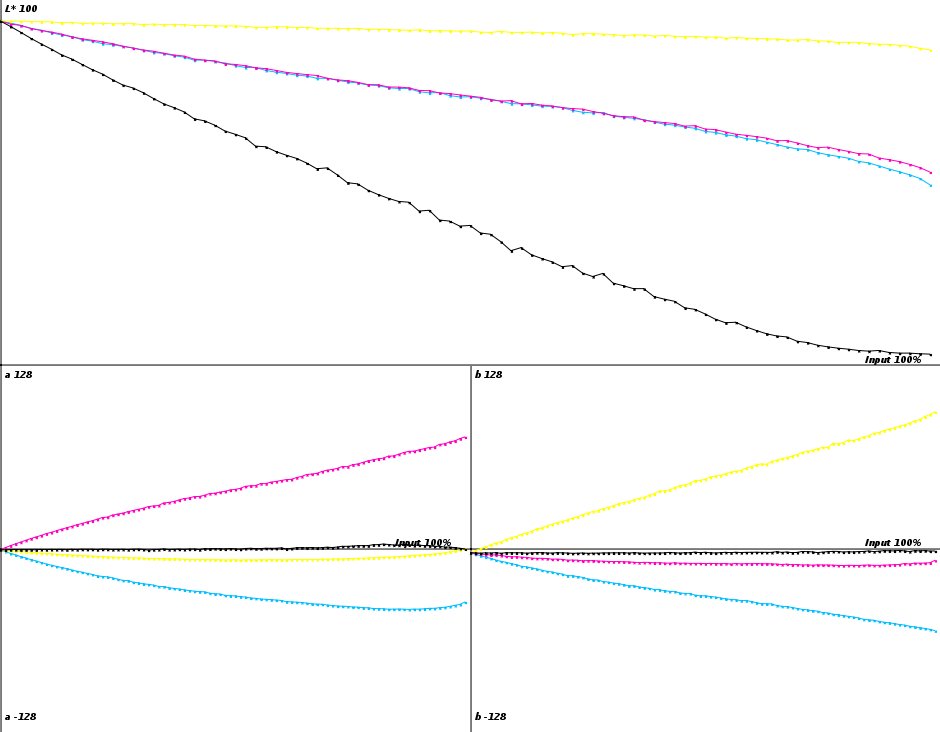
4-channel (CMYK) mode
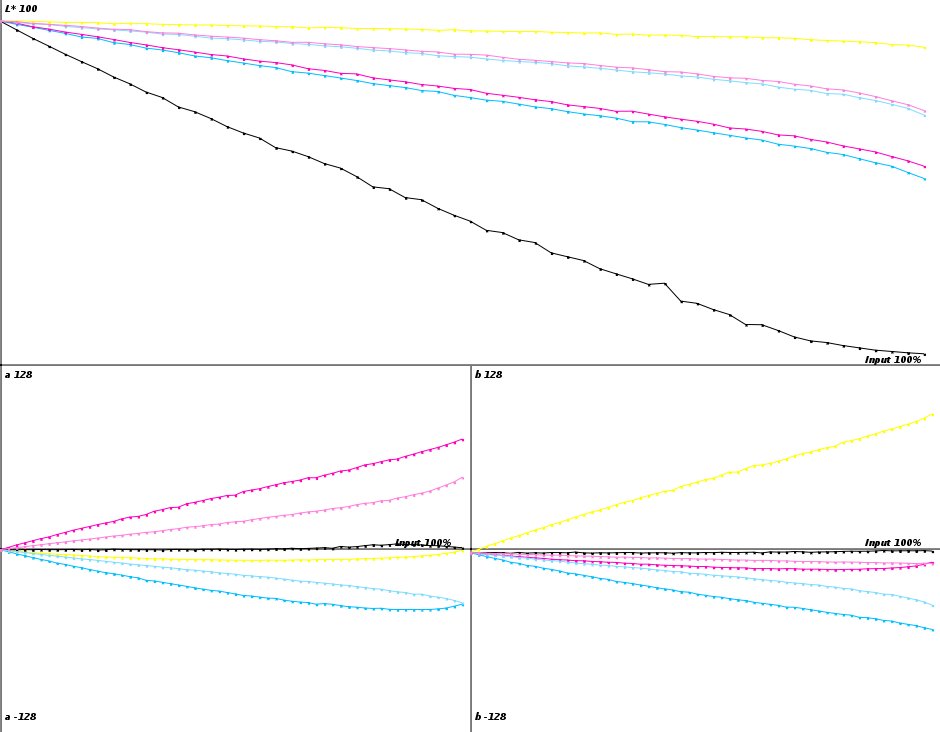
6-channel (Raw) mode
The four-colour chart was produced using a slightly higher Density setting, but otherwise the print settings are identical.
The most significant plot here is the Input vs. L* plot, which shows how the patches get darker as more ink is added. Notice, particularly, that the black line is starting to flatten out significantly at the right hand side (suggesting that it's pretty close to its natural ink limit) whereas the colours show no sign of any such effect. The curvature to these lines comes from two sources - firstly from the fact that the gamma estimate is only an estimate - and secondly from the fact that the printer's response doesn't perfectly follow a gamma curve.
Note particularly in the 4-colour chart, that the Cyan and Magenta curves are vaguely S-shaped. This is a non-linearity introduced by combining the regular and light variants of each colour into a single channel.
